Dashboards
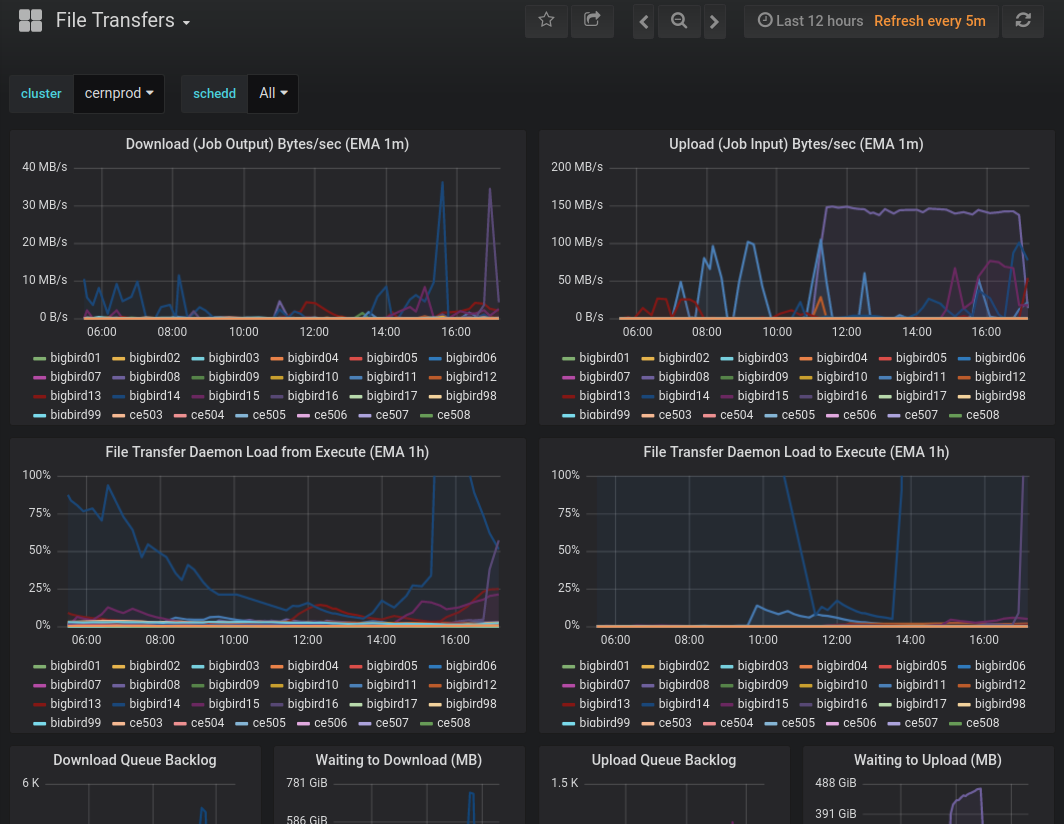
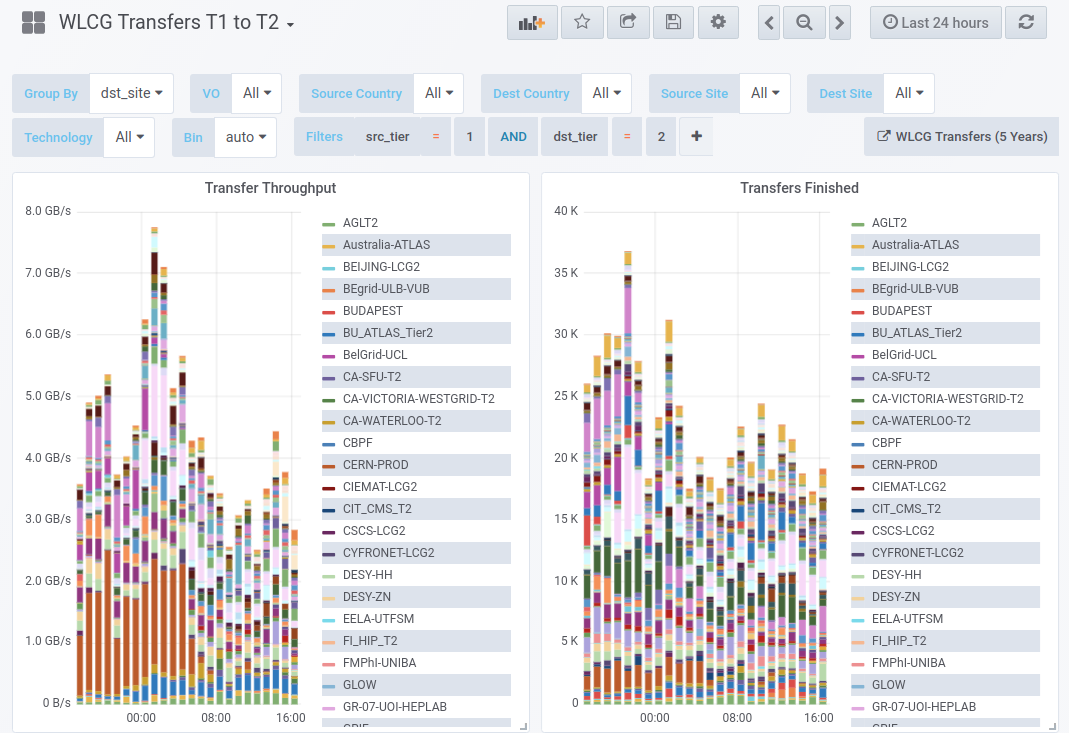
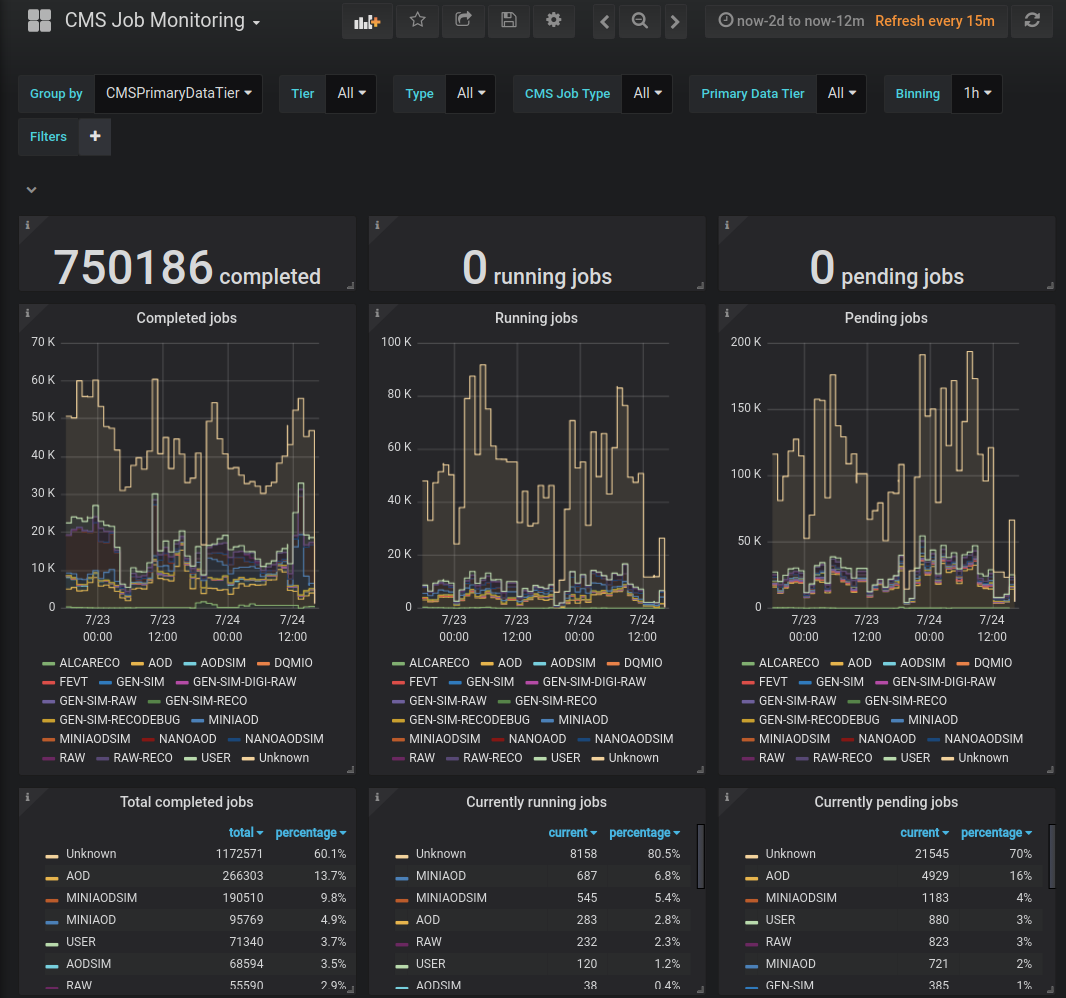
Direct access to general MONIT dashboards
Gallery
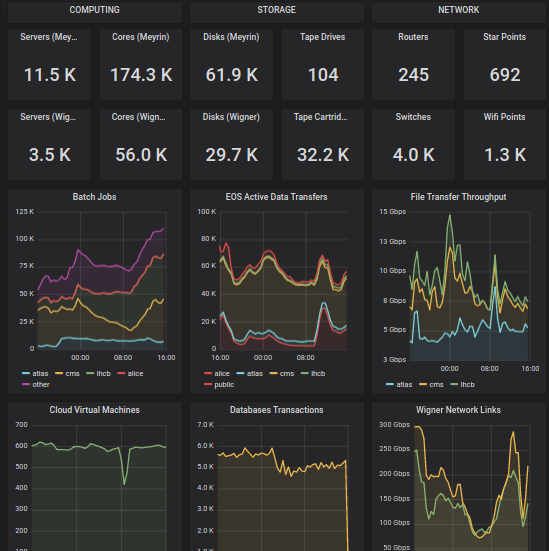
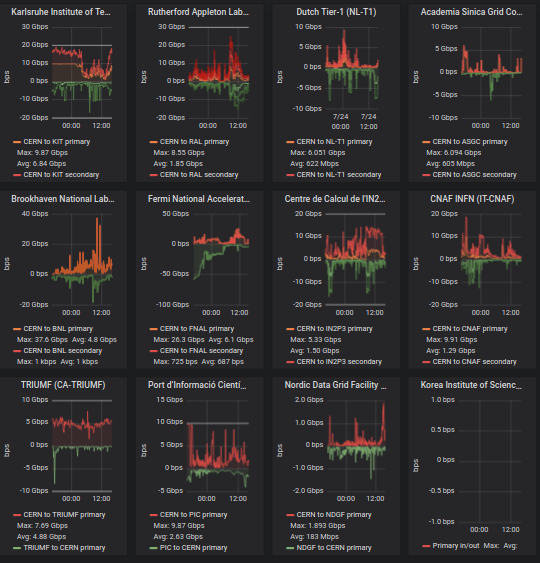
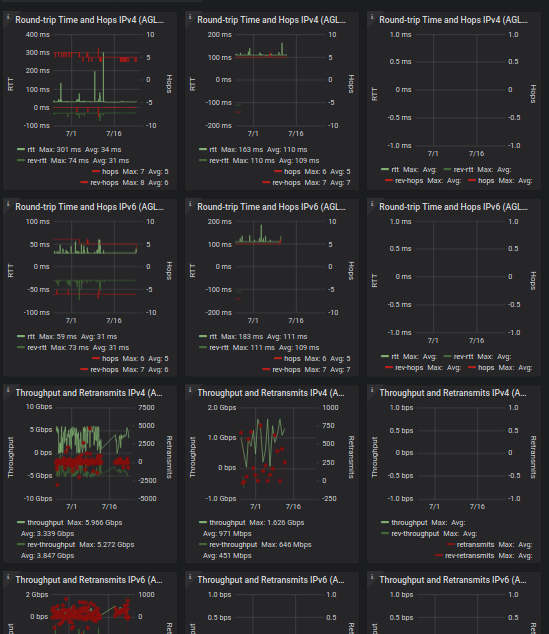
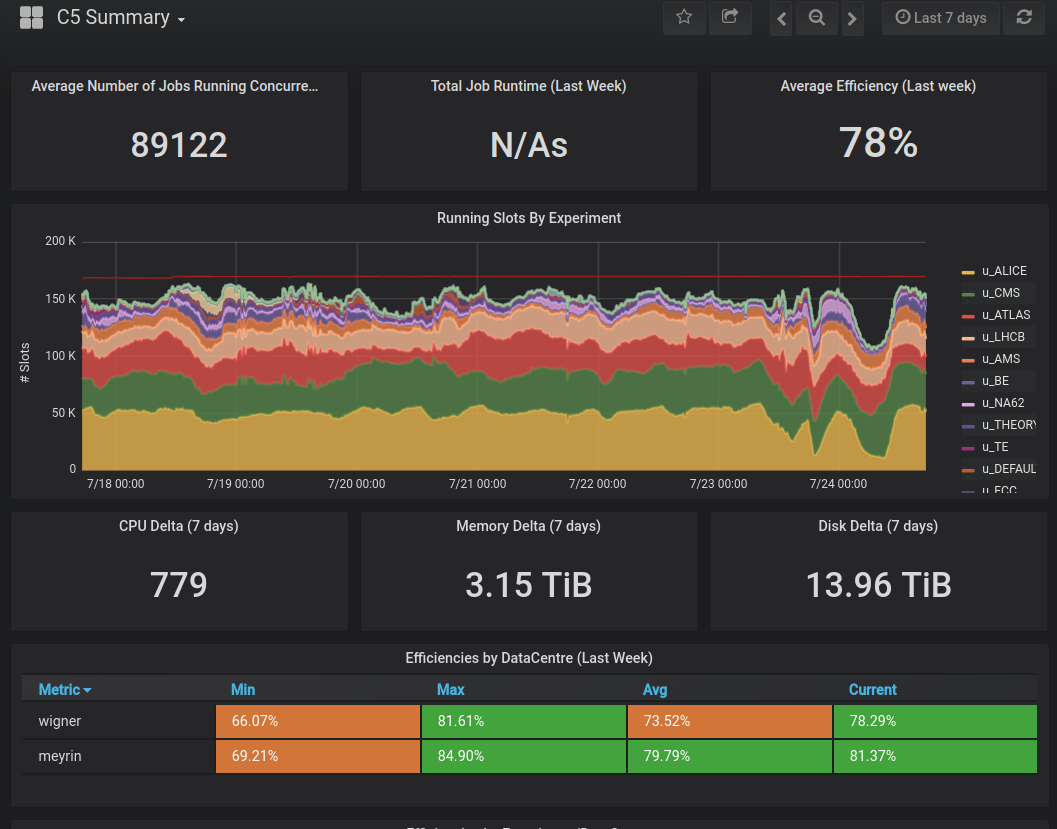
Examples of use of the MONIT infrastructure in CERN IT and WLCG Infrastructure
Services
Services provided by MONIT
GRAFANA
Use Grafana for plotting time series metrics from different datasources like Elasticsearch or InfluxDB. Go to MONIT-GRAFANATIMBER
Use Timber to explore logs stored in Opensearch and interactive data discovery and plotting.(IT only) Go to MONIT-TIMBEROPENSEARCH
Use Opensearch to explore metrics stored in Opensearch and interactive data discovery and plotting. Go to MONIT-OPENSEARCHSWAN (Jupyter)
Use Swan to generate more advanced reports and visualizations over HDFS with the help of Spark. Go to SWANMain Features
Secure and Solid Dataflow
Dataflow with 72h buffering based on Flume and Kafka. Secure data transport and storage.
Open Source Technologies
Full adoption and contribution to established solution such as Collectd, Kafka, Spark and Grafana.
Multiple Storage and Access
Data stored on InfluxDB, Opensearch and HDFS, accessibile via Grafana, Opensearch dashbaords and Swan (Jupyter).
Easy Integration
There are mulitple ways to set new data sources for metrics and logs (AMQ, AVRO, HTTP, etc.).
Dashboards & Search
All data, metrics and logs, can be quickly displayed or searched via Grafana and Opensearch dashboards or prgrammatically.
Analytics
Data for analytics is programmatically available, in Spark or Python, on historical data up to 5 years.
Learn More
Contacts
monit-support@cern.ch
